Y3K Tutorial
The Y3K dataset is available for download as a supplementary table as part of our publication in Nature Biotechnology . The dataset can also be explored and queried online using this web portal. Below we highlight a number of ways in which you can explore the Y3K dataset online.
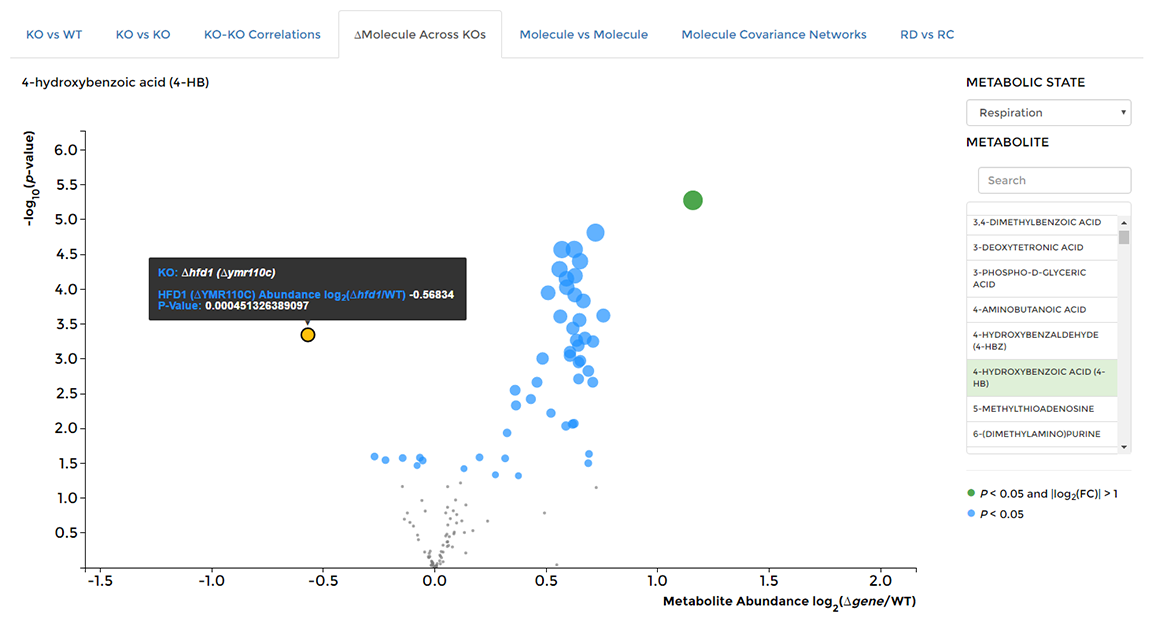
On the 'Data Visualization' page select the '∆Molecule Across KOs' tab, then choose the molecule you are interested in from the list on the right hand side of the window. Hover over individual data points to see the KO strain of origin.
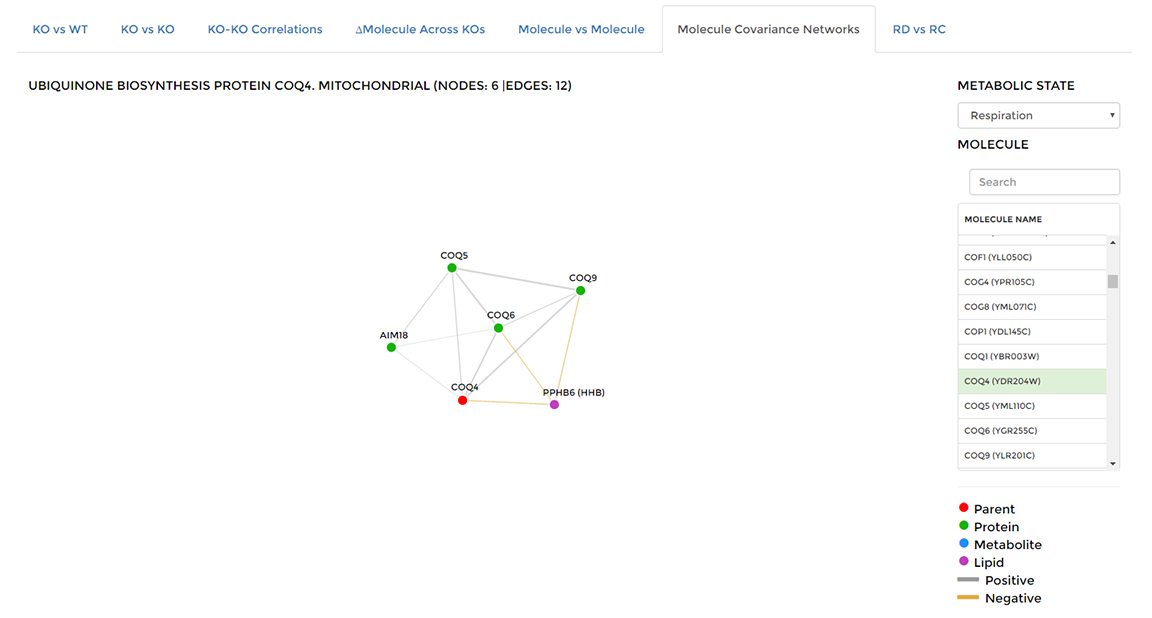
On the 'Data Visualization' page select the 'Molecule Covariance Networks' tab, then choose the molecule you are interested in from the list on the right hand side of the window. Coexpressed molecules will be shown as a network with positively correlated pairs connected by gray edges, negatively correlated pairs connected by gold edges. You can highlight the molecules that are coexpressed with any single node by double-clicking that node. Double-click that node again to restore the entire network.
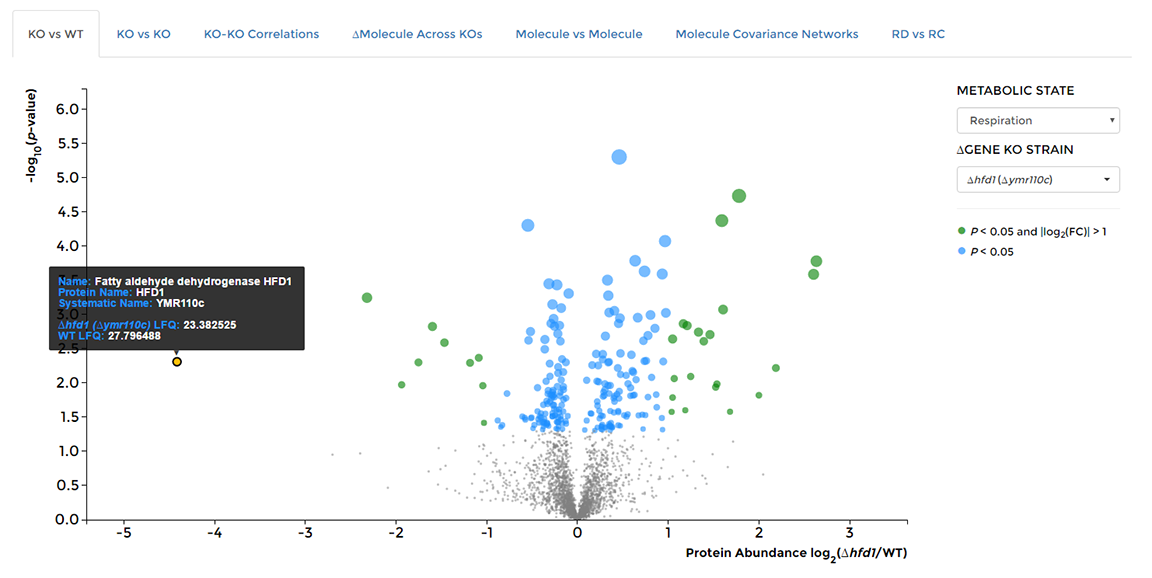
On the 'Data Visualization' page select the 'KO vs WT' tab, then choose the deleted gene of interest from the dropdown on the right hand side of the window. Hover over individual data points to see the molecule of origin.
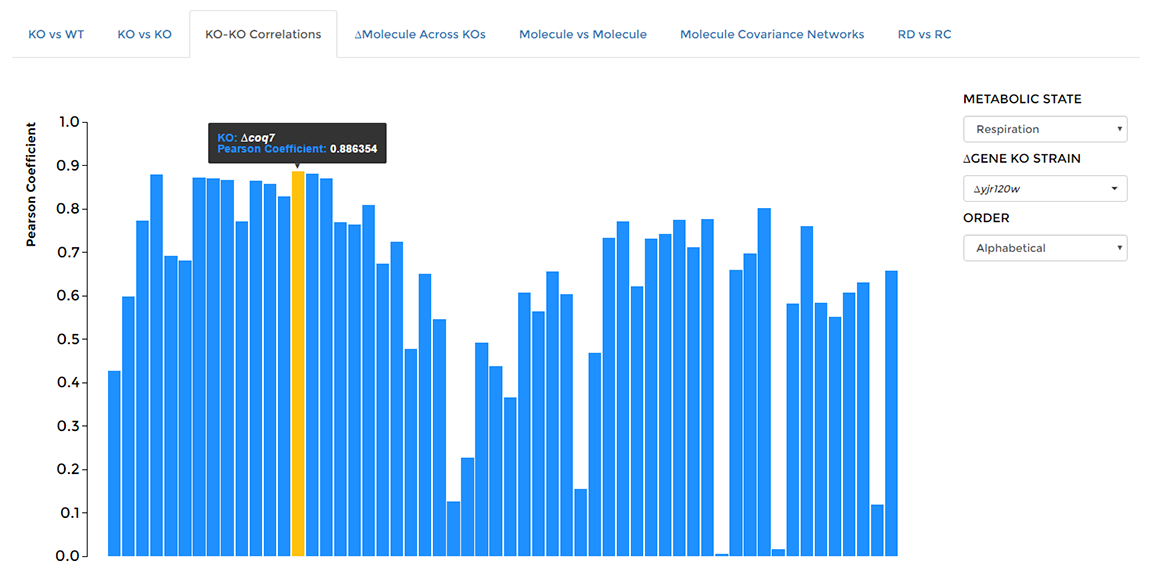
On the 'Data Visualization' page select the 'KO-KO Correlations' tab, then choose the deleted gene of interest from the dropdown on the right hand side of the window. Hover over individual bars to see Pearson coefficient and compared KO strain name.
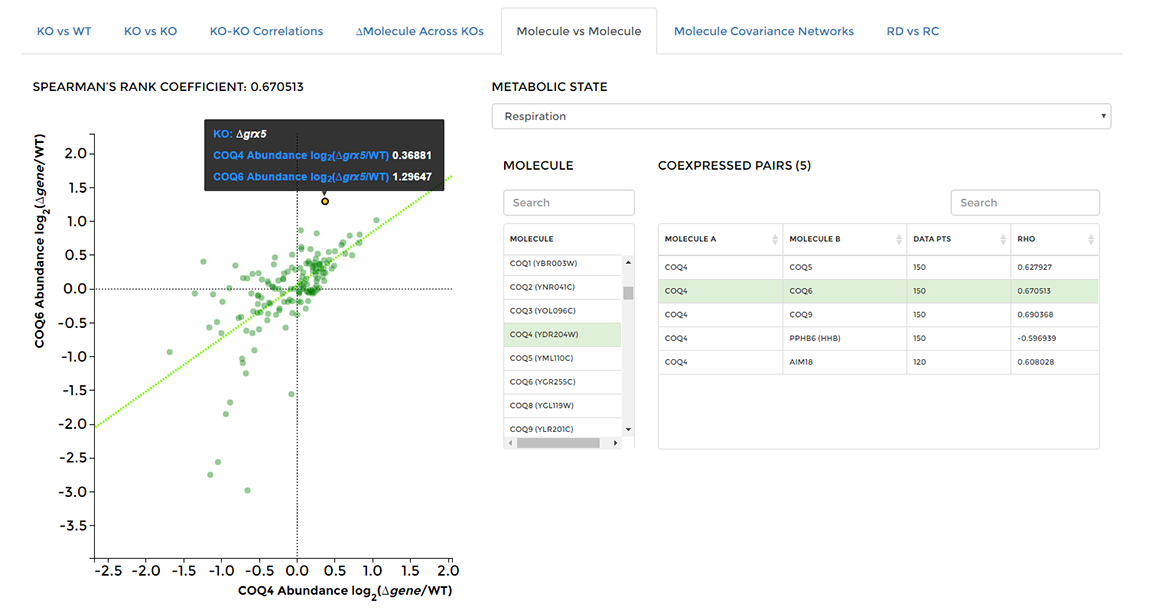
On the 'Data Visualization' page select the 'Molecule vs Molecule' tab, then choose a molecule of interest from the center list. All molecules that are coexpressed with the selected molecule will appear in the table on the right. Select a single molecule from the table to observe how each molecule's abundance changes across all KO strains in the study. Hover over any data point to see the KO strain of origin and fold changes for both selected molecules.
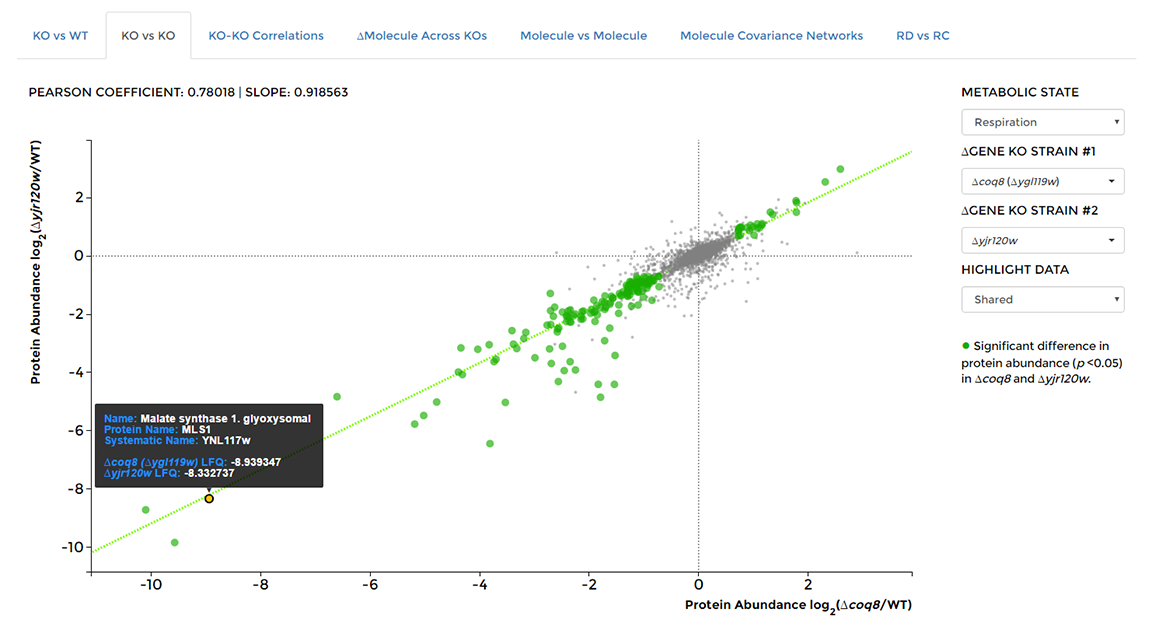
On the 'Data Visualization' page select the 'KO vs KO' tab, then choose two KO strains from the drop down lists on the right of the window. Hover over any data point to see the molecule of origin, as well as measured fold changes.
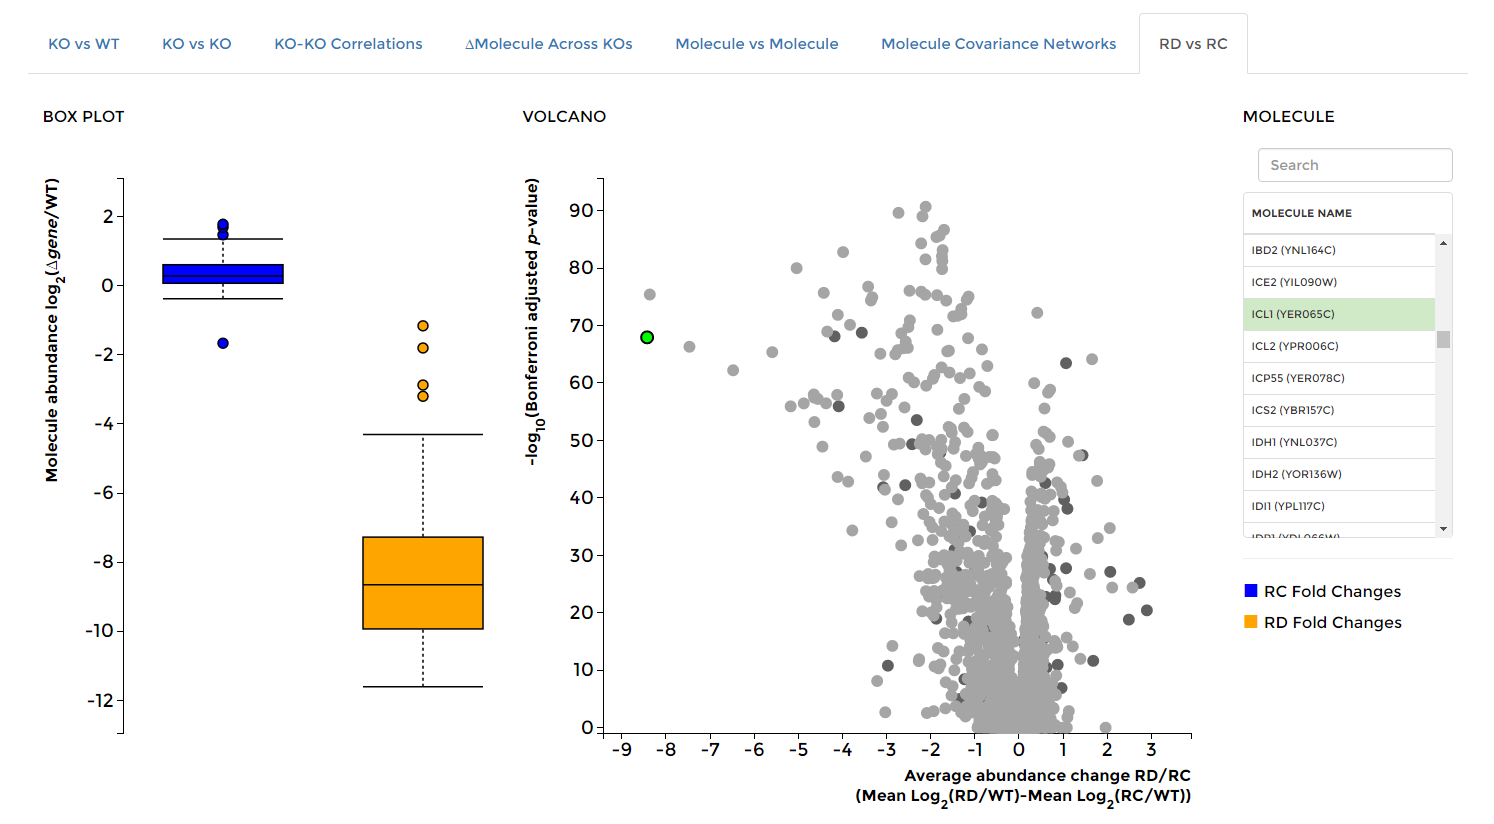
On the 'Data Visualization' page select the 'RD vs RC' tab, then select any molecule of interest. Box plots will appear showing the distribution of fold changes across all respiraton competent (RC, blue) and respiration deficient (RD, orange) strains. The selected molecule will also be highlighted in green in the averaged RD vs RC volcano plot on the right.
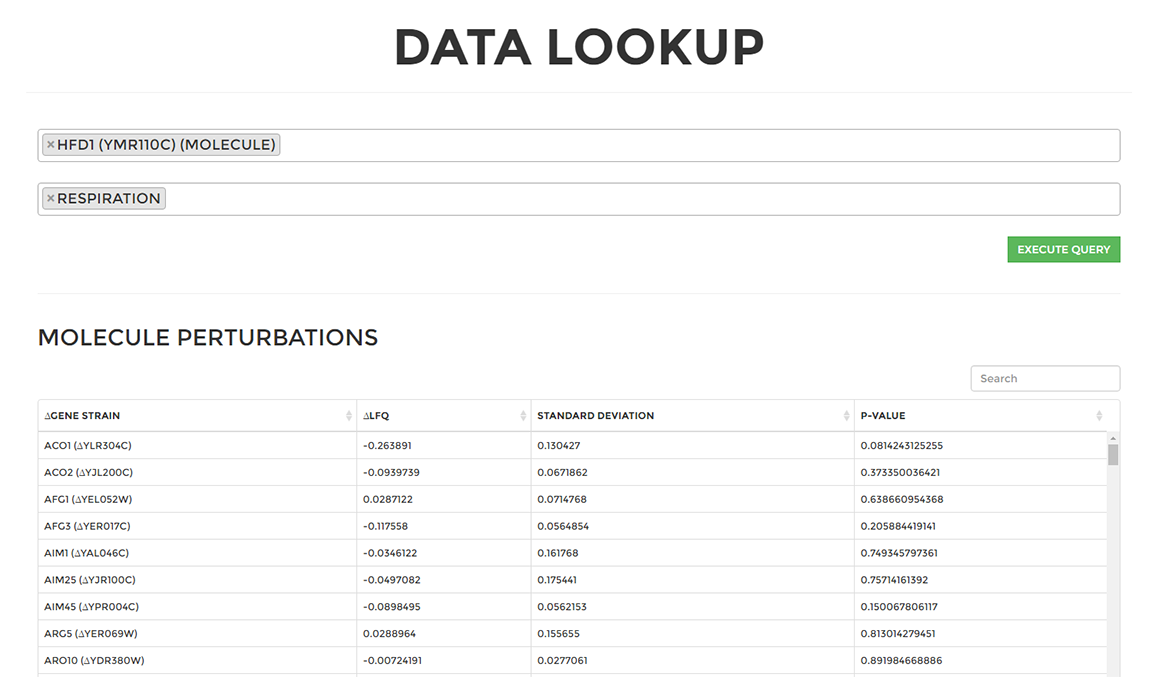
On the 'Lookup Data' page select you can query data from any molecule or strain across all growth conditions. These queried results are populated in the tables below which can be exported to a CSV file by clicking the 'Download Data' button.
Contact Us
If you encounter any issues while using the Y3K web portal, or have comments, questions, or other feedback please feel free to Contact Us.